KNNL - Linear Regression
Datasets/Programs
Typographical
Errors
Problem 4.12
Property
Assessments
Electricity
Consumption
Per Capita Earnings
Drug ConcentrationPatient
Solution Concentration
Sales Growth
Production Time
Blood Pressure
Brand Preference
Grocery Retailer
Problem 6.12
Problem 6.13
Patient Satisfaction
Commercial Properties
Problem 6.20 Problem 6.21
Steroid Level
Assessed Valuations
Job Proficiency
Problem 9.22
Lung Pressure
Kidney Function
Cosmetics Sales
Problem 11.9
Computer-assisted Learning
Machine Speed
Employee Salaries
Chemical Shipment
Problem 11.10b
Weight and Height
Cement Composition
Crop Yield
Mileage Study
Microcomputer Components
Advertising Agency
McGill Company Sales
Home Computers
Problem 13.9
Enzyme Kinetics
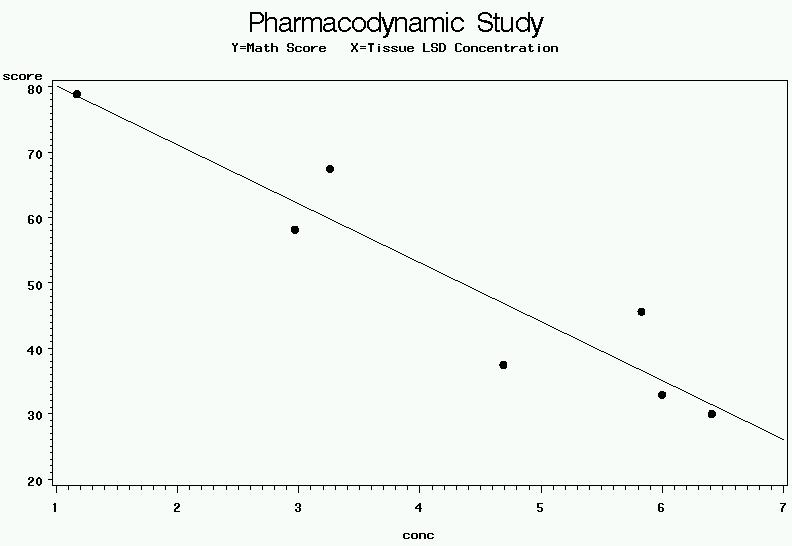
Drug Responsiveness
Process Yield
Annual Dues
Performance Ability
Bottle Return
Toxicity Experiment
Car Purchase
Flu Shots
In-Chapter Exercise Table Data Sets
Table 1.1 - Page 19 - Toluca
Company Example
Chapter
1
EXCEL Spreadsheet
R Program
R Text Output
R Graphics Output
Chapter
2
R Program
Text
Output Graphics Output
Chapter 3
EXCEL Spreadsheet
R Program
Text Output
Graphics Output
Chapter
3
(Loess
Plot)
R Program
Graphics Output
Chapter
5
R Program
R Output
Table 2.4 - Page 88 - Sales
Marketing Example
EXCEL Spreadsheet
R Program
R Output
Table 3.1 - Page 105 - Transit
Example
EXCEL Spreadsheet
R Program R Output
R Graphics Output
Table 3.4 - Page 120 - Bank Example
EXCEL Spreadsheet
R Program
R Output
R Graphics Output
Table 3.7 - Page 130 - Sales
Training Example
R Program R Output
R Graphics Output
Table 3.8 - Page 133 - Plasma
Levels Example
R Program R Output
R Graphics Output
Table 3.10 - Page 141 - Plutonium
Measurement Example
Table 4.2 - Page 163 - Warehouse
Example
R Program
R Output
R Graphics Output
Section 6.9 -
Dwaine
Studios Example
R Program
R Output
Table 7.1 - Page 257 - Body Fat
Example
R Program
R Output
Table 7.5 - Page 277 -
Dwaine
Studios Example
R Program
R Output
Table 7.6 - Page 279 - Work Crew
Productivity Example
Table 8.1 - Page 300 - Power Cells
Example
R Program R Text Output
R Graphics Output
Table 8.2 - Page 317 - Insurance
Innovation Example
R Program R Text Output
R Graphics Output
Table 8.5 - Page 330 - Soap
Production Lines Example
Table 9.1 - Page 350 - Surgical
Unit Example
R Program
R Text Output
R Graphics Output
Table 9.5 - Page 374 - Surgical
Unit Example
R
Program R
Text Output
Table 10.1 - Page 387 - Life
Insurance Example
R
Program R Text Output
R Graphics Output
Table 10.3 - Page 397 - Body
Fat Example (Continuation of Table 7.1)
R Program
R Text Output
R Graphics Output
Section 10.6 - Surgical Unit Example
Table 11.1 - Page 427 - Blood
Pressure Example
R
Program
R Text Output
R Graphics Output
Table 11.4 - Page 443 - Mathematics
Proficiency Example
R
Program
R Text Output
R Graphics Output
Table 11.7 - Page 451 - Life
Insurance Example
R
Program
R Graphics Output
Table 11.8 - Page 453 - Steroid
Level Example
Section 11.4 - P. 457 - University
Admissions Example
R Program
R Text Output
R Graphics Output
Table 11.9 - Page 461 - Toluca
Company Example
R Program
R Text Output
R Graphics Output
Table 11.10 - Page 462 - Blood
Pressure Example
R Program
R Text Output
Table 11.11 - Page 465 - MNDOT
Traffic Estimation Example
Table 12.2 - Page 489 - Blaisdell
Company Example
R
Program
R
Text
Output
R Graphics Output
Table 13.1 - Page 515 - Severely
Injured Patients Example
R
Program
R Text Output
R Graphics Output
Table 13.4 - Page 534 - Learning
Curve Example
R
Program
R Text Output
R Graphics Output
Table 14.1 - Page 566 - Programming
Task Example
Table 14.2 - Page 569 - Coupon
Effectiveness Example
Table 14.3 - Page 574 - Disease
Outbreak Example